Before using this platform, please carefully read and fully understand all the contents of this Agreement. Clicking the "Agree" button below shall constitute the user's full understanding and acceptance of all the contents of this Agreement. The user's use of all functions of the platform's services shall be bound by this Agreement and the user shall assume corresponding responsibilities and obligations.
I. Service Terms Explanation
All ownership and operation rights of the various services on this platform belong to this platform. The services provided by this platform will be strictly implemented in accordance with the published service terms and operating rules. Users must carefully read and agree to all service terms before use. These Agreement terms are the basis for regulating the rights and obligations of both parties and shall remain valid unless they violate mandatory national laws.
II. Service Overview
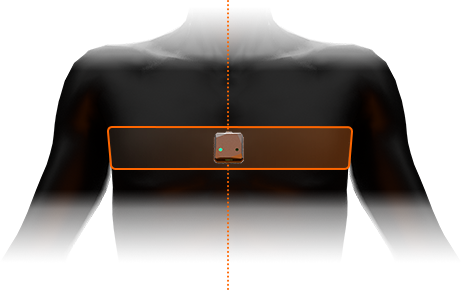
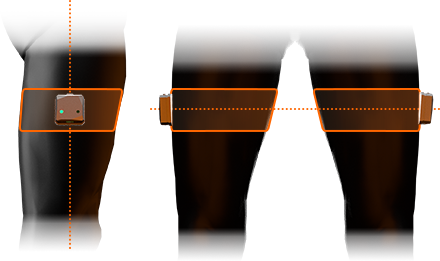
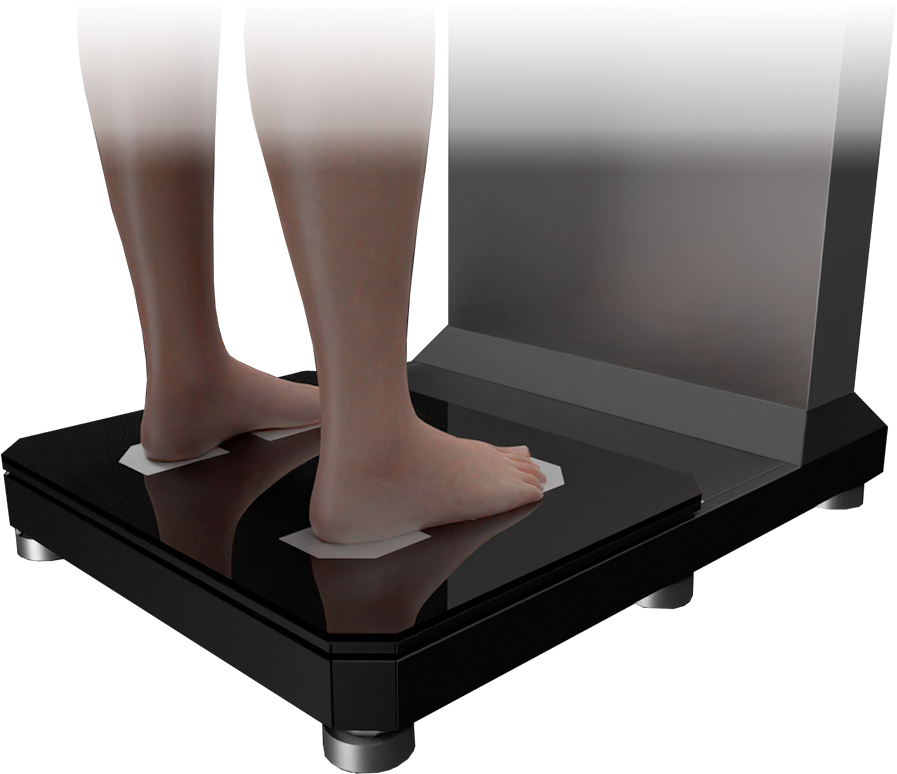
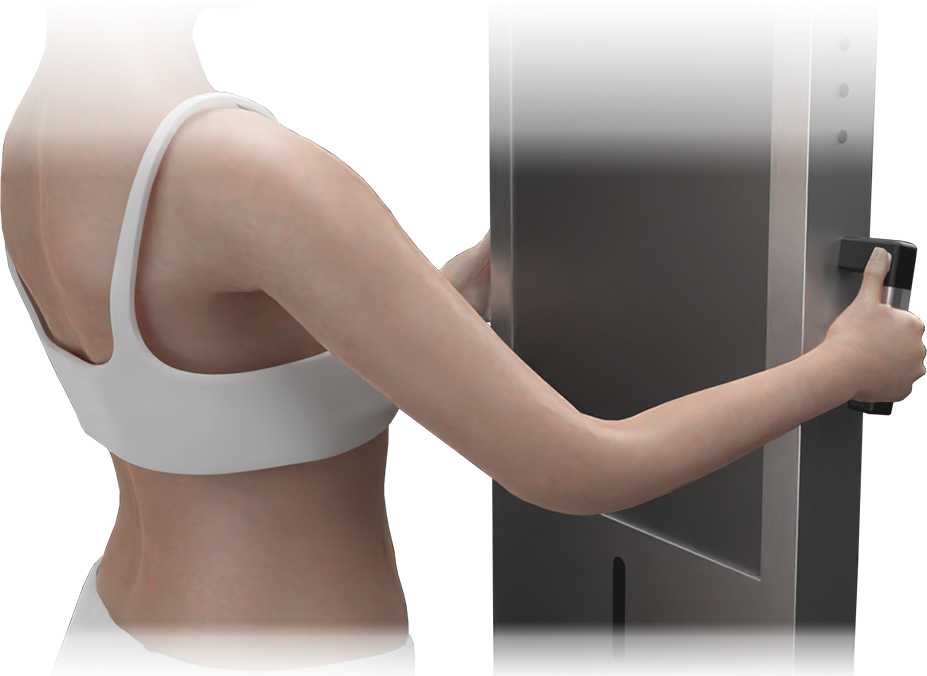
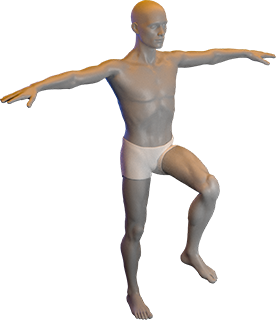
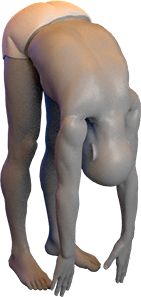
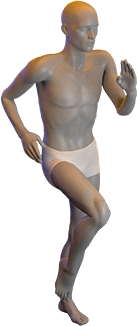
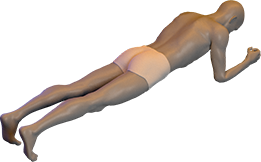
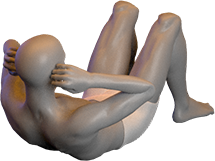
This platform provides users with sports ability testing and related services. Users are required to wear the necessary testing equipment. Based on the functionality of the services provided by this platform, users must agree to provide and fill in accurate personal information.
III. User Privacy Protection and Authorization
Users agree that this platform may collect and store user information during use, including but not limited to the data and information voluntarily provided by users, as well as the user's test records and test information collected and obtained by this platform independently. The main purpose of this platform's collection and storage of user information is to improve service efficiency and quality.
This platform will not disclose or provide individual users' personal information and non-public content stored on the platform when using the service to third parties, except in the following cases:
- Having obtained the user's explicit authorization in advance;
- In accordance with the requirements of relevant laws and regulations;
- Pursuant to the requirements of relevant government authorities;
- To safeguard the interests of the public.
This platform may cooperate with third parties to provide users with relevant services. In such cases, if the third party agrees to assume the same responsibility for protecting user privacy as this platform, this platform has the right to provide the user's test data, etc. to the third party.
This platform stores and analyzes data based on the user's test results on the platform. Without disclosing the user's privacy, this platform has the right to analyze the entire user database and use it for commercial purposes.
Users agree that the company and this platform may use data collection devices on the platform's interface.
IV. Limitation of Liability
Due to uncertain factors, the company cannot guarantee that the platform's services will not be interrupted. The company shall not be liable for any service interruption or damages caused to users due to, including but not limited to, defects in the equipment and systems of the company, this platform and relevant third parties, computer failures, virus or hacker attacks, or force majeure such as earthquakes and tsunamis. The user shall bear all relevant losses.
Services provided to users by third-party institutions cooperating with the company shall be the sole responsibility of such third-party institutions, and the company shall not be liable for any such services.
The content of this platform may involve information owned by third parties or third-party platforms. The authenticity, reliability, validity, etc. of such information or third-party platforms shall be the responsibility of the relevant third parties. Users shall independently judge and assume risks for such information or third-party platforms, which has no connection with this platform and the company.
V. Risk Notification
Minors and elderly individuals are advised to take the test accompanied by a guardian. Everyone must be aware of their own physical condition. Those with illnesses or physical disabilities shall take the initiative to inform the staff and coaches; if you have severe health conditions (such as heart disease) or conditions that affect your safe physical activity, please consult a doctor before using this platform; the platform shall not be liable for any illnesses, physical injuries, etc. caused by physical reasons during the test. If you experience abnormal symptoms such as dizziness, vomiting, or chest pain during the test, please stop immediately and seek medical attention if necessary.
The test site is a public place. Please take good care of your personal belongings and do not place valuables randomly. The platform shall not be liable for any loss.
VI. Additional Information Services
While enjoying the services provided by this platform, users agree to receive various additional information services provided by this platform.
VII. Right of Interpretation
This platform reserves the right of interpretation of this Agreement. If any clause conflicts with relevant national laws, the explicit provisions of national laws shall prevail.
VIII. Others
Please use this platform and related equipment with care. Anyone who engages in intentional malicious damage shall compensate according to the degree of damage.